
Author: Jean-Eloi W. Lombard, Imperial College London
Building on our February 16th post, we at McLaren have been working towards the first comparison between high-order simulations computed with Nektar++ (Cantwell 2016) of the McLaren Front-Wing and PIV data.
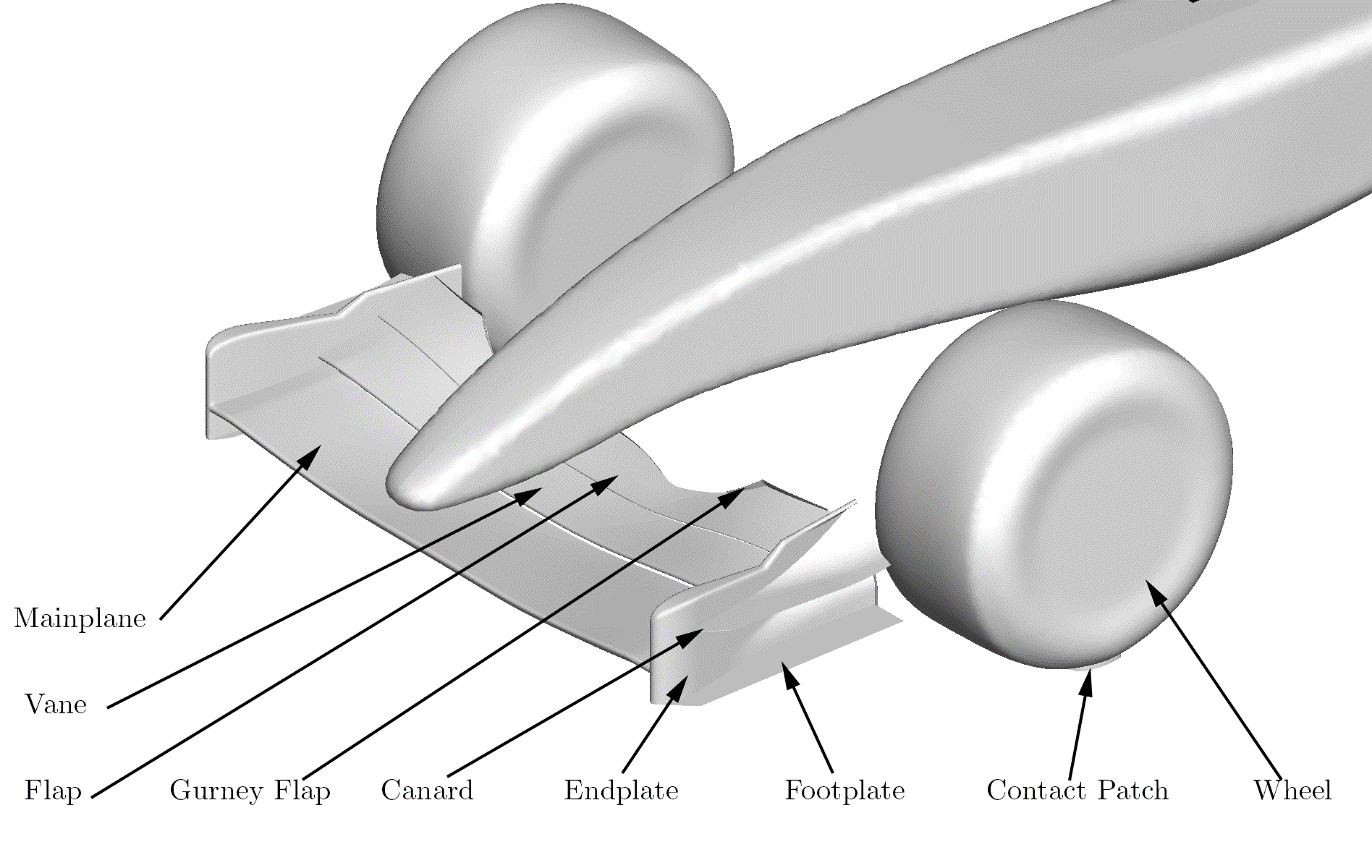 |
One of our key goals remains to assess the accuracy of the high-fidelity LES with respect to experimental data. The different elements composing this geometry are presented in Figure 1. As a first step we have simulated the front-wing without the wheel to focus on the generation of the vortex system on the wing itself. Pegrum (2006) conducted PIV experiments on the same geometry at a ride of height of h/cMP=0.48, where h is the height of the front-wing measured at the trailing edge of the footplate and cMP is the chord of the mainplane. The Reynolds number, based on the chord of the mainplane is the same for both experiment and CFD at Rec|MP = 2.105. |
| Figure 1: McLaren front-wing geometry (Lombard, 2017) | The initial condition for the CFD was a state-of-the-art RANS computation.The flow then developed for 5 time units, based on the length of the chord of the main plane, before the results were averaged for 2 time units. |
Smoke visualization in the wind-tunnel at Imperial College allows for a characterization of the main flow features associated to the near wake, -0.3 < x 0.6, of the front-wing. The coordinate system is such that the center of the wheel is located in x=0 and the trailing edge of the front-wing in x=-0.3. The flow is then quantified by reporting total-pressure distributions at crossflow planes located in x=-0.3, x=-0.15, x=0, x=0.15, x=0.30 and x=0.42. At the trailing edge, in x=-0.3, the flow is composed of four vortices as well as the wake of the wing and gurney flap. These vortices are located at the top of the endplate, the tip of the canard, below the footplate and in the curved region of the endplate. The two strongest vortices are the main vortex, located within the curved region of the endplate and the top, or endplate vortex.
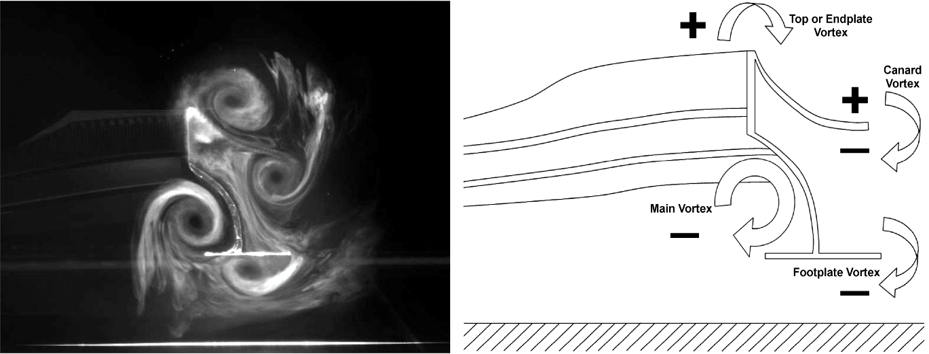
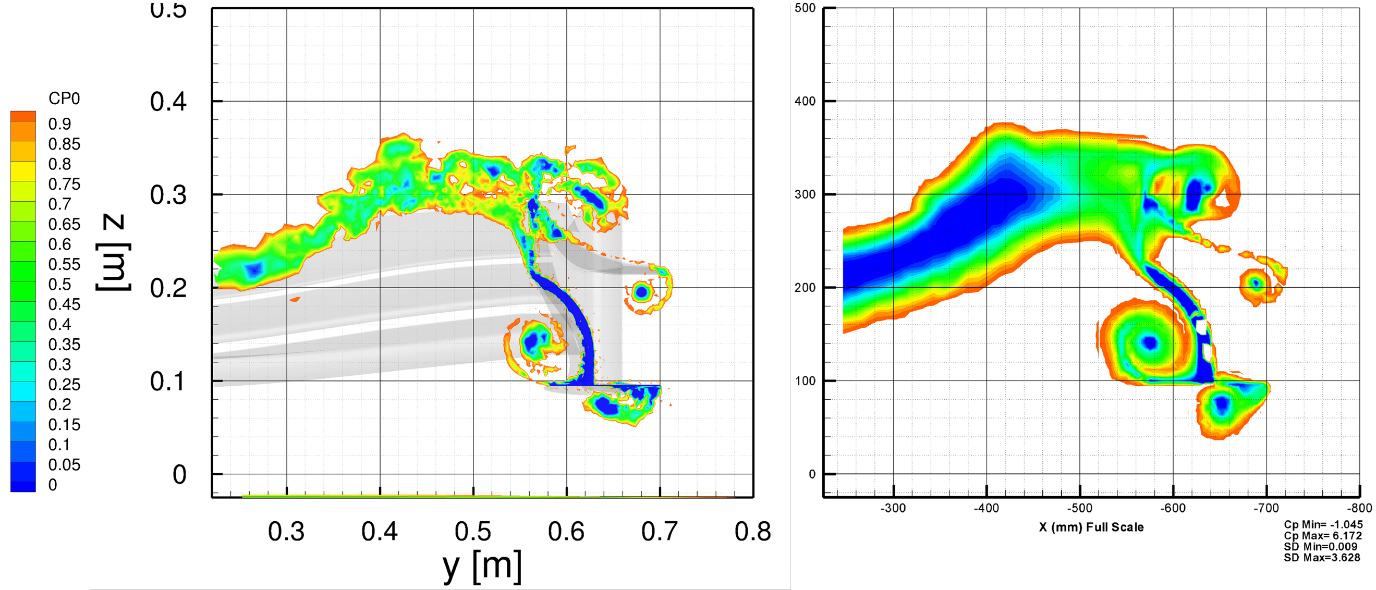 Figure 3: comparison of time-averaged total pressure distribution in x=-0.3, with LES results on the left and experimental data on the right (Pegrum 2006)
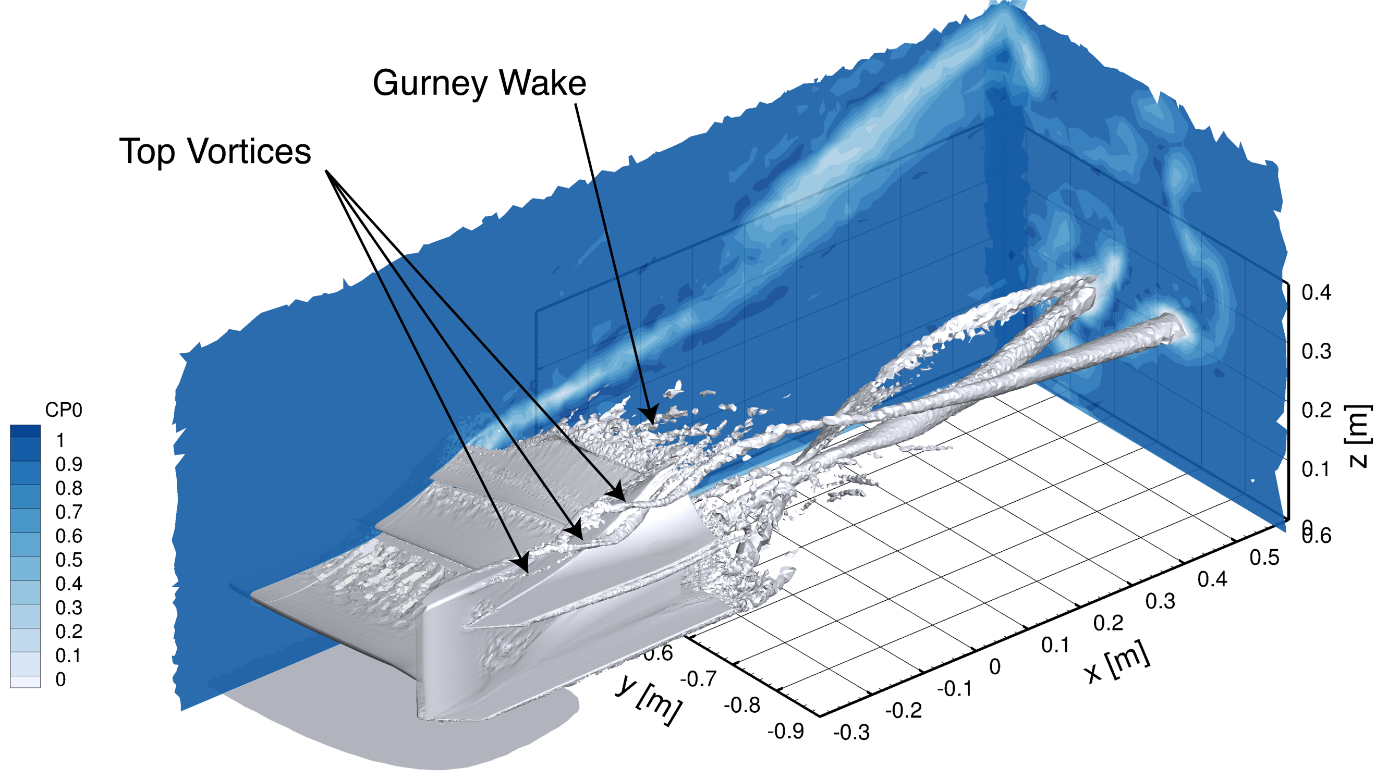 |
The preliminary LES results, with second degree polynomials for the velocity fields and first order for the pressure, (Figure 3, left) resolve the four main vortices, however the top-vortex appears as a multitude of vortices whereas in the experimental results (Figure 3, right) it appears as only two vortices. This discrepancy, and more generally the apparent higher resolution of the CFD data is most likely due to difference in averaging time. The CFD data was averaged over two convective time-unitswhereas the experimental PIV data was averaged over closer to one thousand. The wake of the front-wing, between y=0.25 and y=0.55 in Figure 3 (left) shows higher total pressure than experiment (blue region in Figure 3 (right)). |
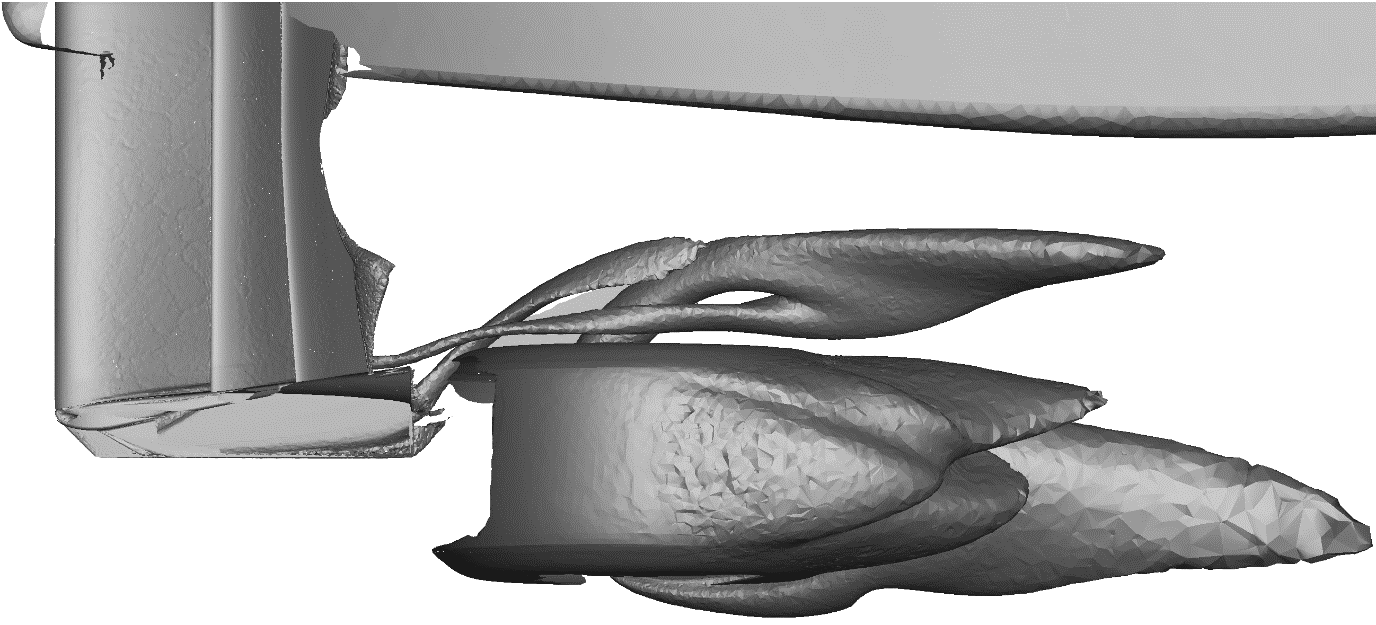
| Figure 4: instantaneous snapshot of iso-CP0=0 showing three vortices merging into the top vortex as well as the streak dominated wake of the gurney flap | Instantaneous snapshot of the flow field in the end-plate region (Figure 4) shows the top vortex is composed of at least three smaller co-rotating vortices that merge into the top vortex. |
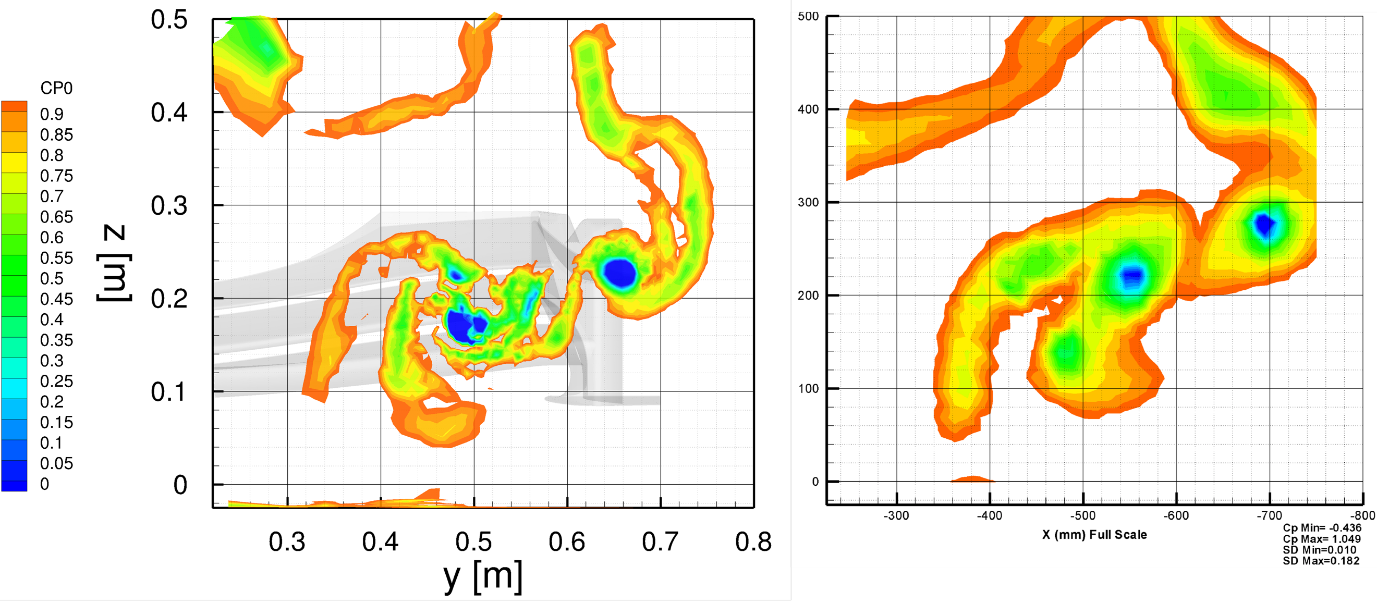 Figure 5: comparison of time-averaged total pressure distribution in x=0.42, with LES results on the left and experimental data on the right (Pegrum 2006)
Analysis of the wake at x=-0.42 reveals further differences between the LES and experimental data. The four vortices are 0.04[m] lower in the LES than the experiment. This is consistent with the difference in wake at x=-0.3[m] where the upwash of the front-wing is weaker. The footplate vortex wrapped around the main vortex faster in the LES its center appearing at (y,z)=(0.48, 0.22) against (y,z)=(0.45, 0.22) for the experiment.
 |
In summary, despite qualitatively resolving the main flow features of the flow, discrepancies remain when quantifying the location of the center of the vortices at x=0.42. The streaky structures apparent in Figure 4 forming the gurney wake suggest stronger detachment for the LES than for the experiment. In view of these results we will next aim to perform an mesh sensitivity analysis, by increasing the polynomial order, to check against mesh induced detachment of the flow on the front-wing mainplane, flap and vane. We will then focus on simulations of the McLaren front-section with both the wing and the wheel. |
| Figure 6: iso-CP0=0 surface of the interpolated RANS solution on the mesh for the LES | An iso-CP0=0 surface of the initial condition for the LES, computed by state-of-the-art RANS, is show in Figure 6. |
References:
Pegrum J. M. 2006 Experimental Study of the vortex generated by a Formula 1 front-wing, PhD Thesis, Imperial College London, 2006.
Cantwell, C. D. and Moxey, D. and Comerford, A. and Bolis, A. and Rocco, G. and Mengaldo, G. and de Grazia, D. and Yakovlev, S. and Lombard, J.-E. and Ekelschot, D. and Jordi, B. and Xu, H. and Mohamied, Y. and Eskilsson, C. and Nelson, B. and Vos, P. and Biotto, C. and Kirby, R. M. and Sherwin, S. J., Nektar++: An open-source spectral/hp element framework, Comput. Phys. Commun., 192, 205-219, 2015