Author: Dr. Christian Jacobs, University of Southampton
In simulations of fluid turbulence, small-scale structures must be sufficiently well resolved. A feature of under-resolved regions of flow is the appearance of grid-to-grid point oscillations, and such oscillations are often used to decide when/where grid refinement is required. Two new error indicators have recently been developed by SOTON as part of the ExaFLOW project, that permit the quantification of these features of under-resolution. These are both based on spectral techniques using small-scale Fourier transforms.
The crux of the approach involves quantifying whether the spectral energy E(k) (and therefore the Fourier mode amplitude Y(k)) of a solution field y decreases at a desired (prescribed) minimal acceptable rate/slope r, such that the smallest scale flow structures have the lowest energy content. If the small scales are not resolved well enough then an increase in E(k) will result and instabilities are likely to occur. Being able to determine and quantify the severity of any deviation away from this acceptable slope facilitates the dynamic focussing of resolution in that area. This is extremely beneficial in the context of exascale scientific computing since accurate simulations can be performed with limited FLOPS and memory resources by only placing resolution where it is needed and ensuring that the number of superfluous grid points is minimised.
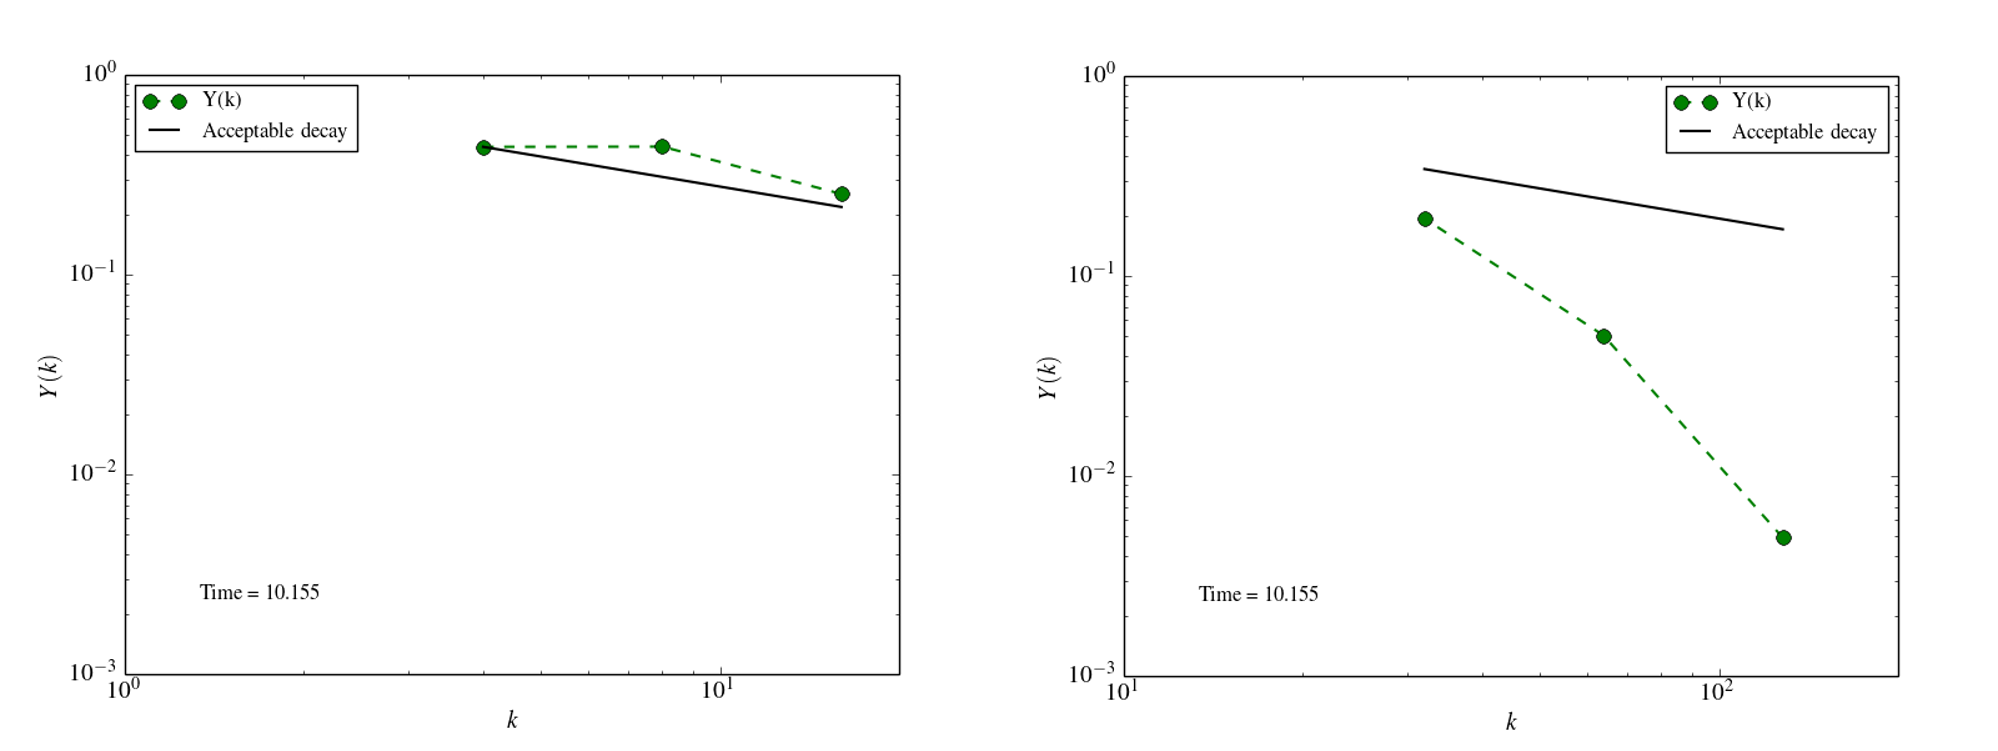
Examples of the reconstructed Fourier amplitudes against a minimal acceptable slope are plotted in Figure 1 below, for a poorly-resolved and well-resolved simulation.

As expected, the spectral energy deviates away from the slope immediately in the poorly-resolved case, whereas the spectral energy decreases faster than the minimal acceptable slope in the well-resolved case as we would hope. The error indicators have been implemented in the OpenSBLI code [1], to take advantage of the ability to target the model's OPS-compliant C code towards a variety of hardware architectures. The algorithm and results discussed herein were presented at the ParCFD 2017 conference in Glasgow, United Kingdom [2].
Algorithm
The overall steps of the error indicator algorithm are as follows.
Partition the domain into N^3 error ‘blocks’ that span the domain. For each error block of N^3 solution points, consider each of the N^2 lines of points in turn. For each line:
- Apply a Hamming window to the solution field of interest, denoted y
- Compute the Fourier amplitudes for wavenumbers N/2, N/4 and N/8 through simple summations to avoid expensive Fourier transforms.
- Take the maximum values of each Fourier amplitude over all N^2 lines. Use this to determine whether the amplitudes are decreasing at the desired rate r
The error indicators are based on quantifying how well the slope decreases at this rate. Both integer-based and floating point-based indicators have been developed, denoted Ii and If here, respectively.
Validation
OpenSBLI was used to perform 3D Taylor-Green vortex [3] simulations in order to evaluate the effectiveness of the error indicators. This considered the fourth-order finite difference solution of the compressible Navier-Stokes equations without explicit filtering/artificial dissipation. Full details of the setup can be found in [1].
The number of 'error indicator blocks' in each direction was set to 4, such that each block contained (N/4)^3 solution points. A single value of Ii and If were calculated for each block. The solution field y, considered by the error indicators, was chosen to be the z-component of the vorticity field because grid-to-grid point oscillations usually first appear in derivative quantities. It was found that the use of a 32^3 grid resulted in a significant amount of grid-to-grid point oscillation (and thus a considerable amount of solution error), especially at the point of maximum enstrophy. Figure 2 below shows how Ii and If successfully indicate that the error severity decreases as the grid is refined, as expected.

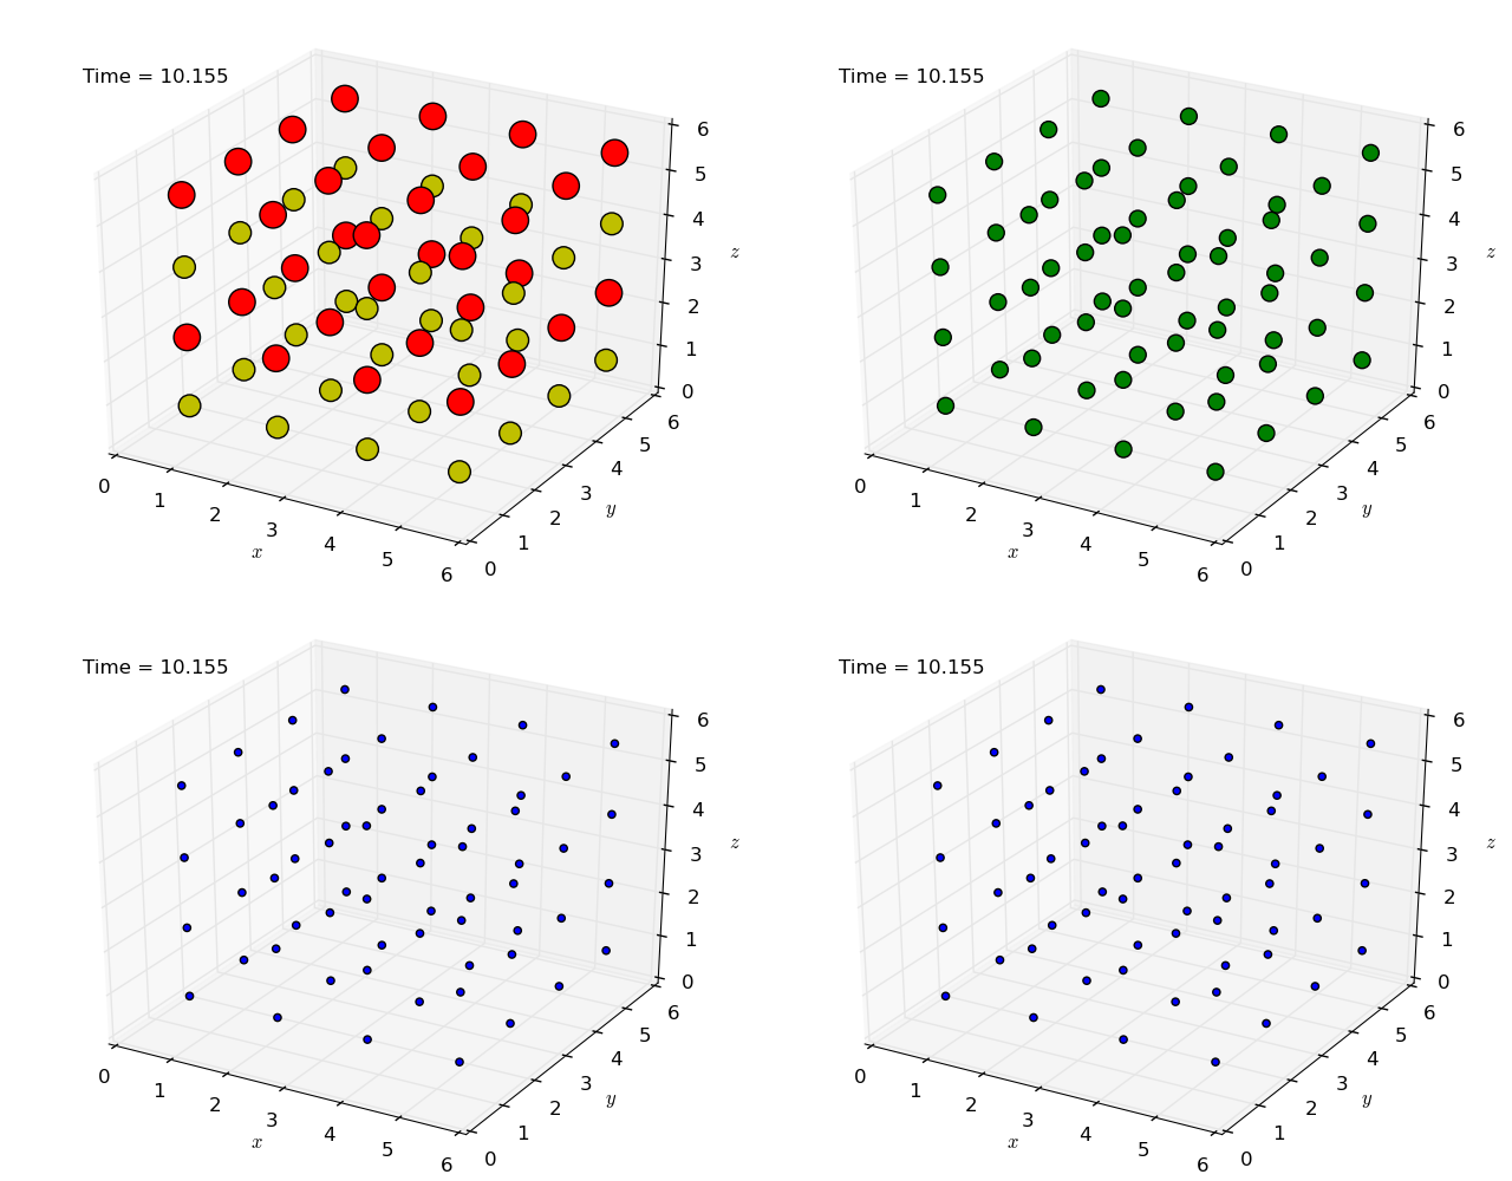
A better visualisation of the effects of refining the grid is given in Figure 3. The total number of high Ii values is greatly reduced throughout time. The point of maximum enstrophy is at t = 9-10 where the flow is turbulent. This point in time yields a much greater number of high severity values, which implies that further grid refinement is necessary to adequately resolve the turbulent structures.

Application: NACA-0012 aerofoil
The application of the error indicators involved a 3D multi-block DNS of compressible flow past a NACA-0012 aerofoil at a Reynolds number Re_c = 5x10^4 and Mach number M=0.4. The domain was partitioned into three blocks, with interface boundary conditions between neighbouring blocks. The error indicator was applied to each domain block, using 16^3 grid points per error block, and once again considered the z-component of the vorticity field. The results for the error severity values can be seen in Figure 4.

The uniform flow away from the aerofoil is well-resolved. However, high error severity can be found along the boundary layers either side of the aerofoil, and also near the trailing edge where eddy shedding occurs. This suggests more resolution would be required in these areas and potentially less elsewhere, which facilitates the highly efficient simulation of large-scale industry-relevant problems.
If you want to find out more about this topic please contact Christian T. Jacobs, Neil D. Sandham or Nicola De Tullio at the University of Southampton.
References
[1] C. T. Jacobs, S. P. Jammy, N. D. Sandham (2017). OpenSBLI: A framework for the automated derivation and parallel execution of finite difference solvers on a range of computer architectures, Journal of Computational Science, 18:12-23, doi: http://doi.org/10.1016/j.jocs.2016.11.001
[2] C. T. Jacobs, N. D. Sandham, and N. De Tullio (2017). An error indicator for finite difference methods using spectral techniques with application to aerofoil simulation. In Abstracts of the Parallel CFD (ParCFD) 2017 conference, Glasgow, Scotland, 15-17 May 2017. Pre-print: https://eprints.soton.ac.uk/407655/
[3] J. DeBonis (2013), Solutions of the Taylor-Green Vortex Problem Using High-Resolution Explicit Finite Difference Methods, 51st AIAA Aerospace Sciences Meeting including the New Horizons Forum and Aerospace Exposition (February 2013), 1-9. doi: http://doi.org/10.2514/6.2013-382


